About solar energy
Definition of terms
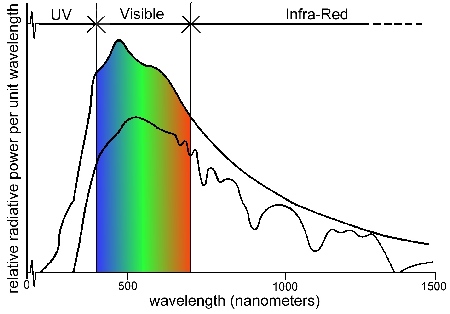
Our sun emits a very broad range of wavelengths of radiation. The distribution of the intensities of these wavelengths reaching the Earth’s atmosphere is given by the upper line in the graph below. As this radiation penetrates the atmosphere, scattering processes and absorption by ozone, water vapour and oxygen molecules modify the intensities of the different wavelengths, resulting in a distribution given by the lower line below. This is known as ‘attenuation’. Note that the exact effect of attenuation will depend on local conditions. The total solar power reaching the earth’s surface (represented by the area under the lower line) is known as incoming solar radiation or ‘global’ radiation.
Graph of the amount of power the sun radiates at different wavelengths (upper line) and that which reaches the Earth's surface (lower line)
The solar spectrum is divided into three ranges:
Ultraviolet. This range is subdivided in UVC, B & A (given from shortest to longest wavelengths). UVC is wholly absorbed by atmospheric ozone, and UVB partly so. Ozone depletion causes an increase in the amount of UVB reaching the Earth’s surface, causing increased danger of sunburn and skin cancer. UVA is not absorbed by ozone, but is less dangerous.
Visible. Also known as PAR, which stands for ‘photo-synthetically active radiation’, this range corresponds to the wavelengths that the human eye and plant life are sensitive to.
Infrared. This is long wavelength radiation, undetectable to the human eye but can be felt as transmitted heat.
Measurements
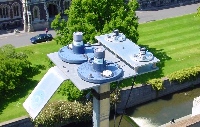
Global radiation is measured using a Li-Cor LI200X Pyranometer (pictured right). It has a silicon photodiode that uses the photo-voltaic effect (a photon-atom collision that results in the ejection of an electron) to produce a current. This is changed to a voltage using a shunt resistor and measured directly by the data-logger. Special scaling factors and calibration are used to estimate true global irradiation as the sensor only responds to the shorter wavelengths (i.e. not long wavelength infrared) and does so in a non-linear fashion. Readings are given in Watts per square meter (W/m2), or in other words, joules of energy received by a metre-square area in a second. Like all the other sensors, it is mounted horizontally.
PAR is measured using a Li-Cor LI190SB Quantum Sensor. Like the other solar sensors, the quantum sensor uses a silicon photodiode, but with special filters to give enhanced response in the visible range (400 – 700nm). The current produced is used to estimate the number of photons incident on a metre squared every second, hence the measurement unit micromoles per second per square metre (µmol/m2s). Photon counting is often used for agricultural and photovoltaic power system research as both are dependent on the number of photon-molecule interactions rather than the total incident thermal power.
UVA and UVB are measured with Skye High-Output Sensors, models SKU 420 and SKU 430 respectively. Both use a photo-voltaic sensor in combination with special filters to detect the wavelengths they are designed for.
Things to look for/Notes
- These sensors record radiation coming from all directions, including solar beam or ‘direct’ radiation, sky or ‘diffuse’ radiation and reflected radiation.
- A perfectly cloudless day should result in a smooth bell shaped curves for all solar sensors. However, you may notice small ‘tails’ at dawn and dusk – this is where the sun is behind the surrounding hills and direct radiation is blocked, but diffuse radiation is still present.
- If there are clouds surrounding (but not obscuring) the sun, a noticable lensing effect can occur. This is commonly seen in the sensor readings as sharp peaks either side of troughs on days with a largely smooth bell-curve profiles: a small cloud moves close to the sun causing lensing and a sharp peak, then obscures it causing a trough. A second peak is caused as it moves away from the sun.
- Because the maximum height in the sky the sun reaches each day changes through the year, so will maximum possible readings of the sensors (discounting incidences of lensing). The maximum possible maximum will occur at summer solstice on December 21st and the minimum possible maximum at winter solstice on June 21st.
- The scale for PAR on the chart has been set such that the approximate radiative power of PAR (in W/m2) can be read off the scale for ‘Global’ on the left-hand side.
- The fact that UV can still burn even with cloud cover can be observed on the weather station charts: cloud diminishes the amount of UV, but it does not eliminate it.


